Reports and growth
Read your sales and profit reports
Understand every line from gross sales down to net profit, find your fast and slow movers, and know which report to open for which question.
5 min read · Updated August 27, 2026
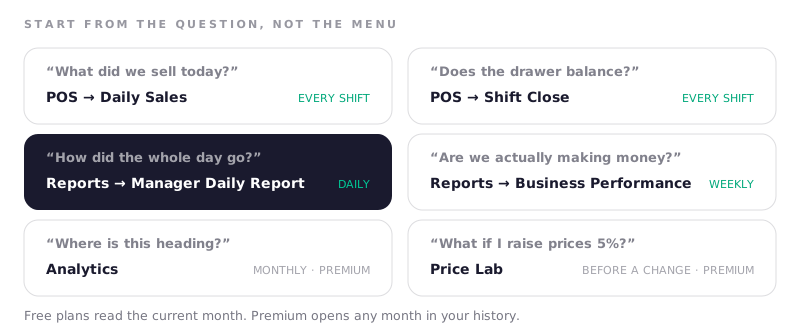
Kasenso has several reporting screens because there are several different questions. Opening the wrong one is why reports feel like a chore — start from the question instead.
The lines, top to bottom
Reports → Business Performance works down from what customers paid to what you kept. Each subtraction answers a different question.
| Line | What it means | What it tells you |
|---|---|---|
| Gross Sales | Everything rung up, before discounts | Volume |
| Discounts | Money deliberately given away | Whether promos are under control |
| Net Sales | What customers actually paid, tax still inside | Your real takings |
| Tax | Owed to the government, excluded from profit | Not yours — never read it as income |
| Sales without Tax | Net sales with the tax lifted out | Where every profit line starts |
| Cost of Goods Sold | Ingredients and packaging, from recipes | What the food cost |
| Gross Profit | Sales without tax, minus cost of goods | Whether your prices work |
| Operating Expenses | Rent, utilities, salaries | The cost of the doors being open |
| Operating Profit | After running costs | Whether the shop works |
| Net Profit | After non-operating costs such as interest | What you actually made |
Two of these do most of the work. Gross profit is a menu-pricing question: thin gross profit means prices or portions, and Price Lab is where you model the fix. Operating profit is an overheads question: healthy gross profit with thin operating profit means your costs, not your menu.
Service charge is counted in profit. Tax is not. Kasenso labels both on screen so they never blur together.
Gross sales and net sales will usually look close together, and that is correct. The only thing between them is discounts. If your prices include tax — the default — then the tax is sitting inside both figures and does not widen the gap at all; it comes out one line further down, at Sales without Tax. A day showing 44,310 gross and 44,070 net means 240 of discounts given, nothing more sinister.
Cost ratio
The Cost Ratio KPI is your costs as a share of sales excluding tax — the fastest single health check on the page. Watch its direction over weeks rather than its value on any one day; a single quiet Tuesday moves it and means nothing.
Fast and slow movers
Two lists worth ten minutes a month:
- Fast-Moving Items / Most Used — highest consumption. These are what to keep stocked, what to negotiate on, and what a stockout hurts most.
- Slow movers — lowest consumption. Each one is money sitting on a shelf and a line on a menu that is making the busy items harder to find.
A slow mover that is also high-waste is costing you twice. Either promote it properly or take it off — see wastage.
Every product you sold
The Products tab lists every product sold in the period, not just the top ten. Switch between By Qty to see what goes out the door most, and By Revenue to see what brings in the most money — they are rarely the same list. Pick Today, This Week, a month or This Year at the top of the page and the list follows it.
Other splits worth reading
- Payment Methods — cash, card, e-wallet. Tells you how much cash you are really handling, which is a security and a banking question.
- Dine-in vs Takeout vs Delivery — whether delivery earns its packaging and its hassle.
- Cashier — filter the whole report by who was on. Useful for coaching, and for spotting who is actually upselling.
- Extra Revenue from Upsize — what upsizing earned, and which product gets upsized most.
- Month-over-month and year-over-year — the comparison that separates growth from seasonality.
Choosing a date range
The range picker drives everything on the page. Sensible defaults: this week for operations, this month for money, month-over-month for trend.
Reports open any month in your history, and CSV export hands the raw rows to Excel or your accountant.
A rhythm that works
- Every shift — Daily Sales and the shift close.
- Every day — the Manager's Daily Report.
- Every week — Business Performance. Gross profit and cost ratio.
- Every month — expenses by category, slow movers, and Analytics.
Fifteen minutes a week beats three hours once a quarter, because a weekly read catches a problem while it is still small enough to fix.
Frequently asked questions
Why is my net profit lower than my gross profit?
Gross profit only subtracts the cost of the goods you sold. Net profit also subtracts your overheads — rent, utilities, salaries — and any non-operating costs such as interest. If the gap looks wrong, check that your expenses are complete and that ingredients are not being counted twice.
Why are my gross sales and net sales almost the same?
Because the only difference between them is discounts. Tax does not widen that gap: with tax-inclusive prices it is already inside both numbers, and it is removed further down at Sales without Tax, which is what the profit lines are built on. If the two are nearly identical, you simply gave very few discounts in that period.
Is tax counted as revenue in Kasenso?
No. Tax is treated as money owed to the government and is excluded from profit figures, and shown on its own line. A service charge is the opposite — it is your revenue and is counted in profit.
How far back can I see reports?
Any month in your history.
Can I export reports to Excel?
Yes. CSV export is included, and the reports are readable on screen and printable too — export matters most when an accountant needs the raw rows.
Why do my report figures differ from my drawer count?
They measure different things. Reports count all revenue; the drawer count only covers cash. Card and e-wallet sales are revenue that never entered the cash box — see start and close a shift.
Next: the Manager's Daily Report.