How to build a strategy when sales are slow
September 29, 2026 · Kasenso · 9 min read

There is a difference between doing something about a slow month and having a plan for it, and the difference is usually visible from outside. The shop with no plan runs a promo, changes the menu board, posts twice, tells the staff to upsell, and then cannot tell you a month later which of those did anything. The shop with a plan changed one thing, knew which number it was trying to move, and found out.
A strategy at this size is not a document. It is one lever, one number, and one deadline. The hard part is not the writing — it is choosing the lever, and that is the part your own sales data is genuinely good at.
First, twenty minutes of diagnosis
Everything below assumes the drop is real and you know its shape. If you have not done that yet, do it before you plan anything: check the same weekday rather than yesterday, check the same season last year, and split the fall into customers and average order, because those two point at opposite fixes.
That is a whole job in itself and it is written up separately in what to do when sales are slow. Come back when you can say, in one sentence, what is actually down.
Let the numbers choose the lever
Here is where most plans go wrong. The lever gets chosen by what hurts most visibly — sales are down, so the plan is about sales — and the obvious lever is frequently the wrong one.
Your month-over-month breakdown does not stop at "profit fell". It names each driver and what that driver did to your profit, so a bad month arrives with its cause attached.
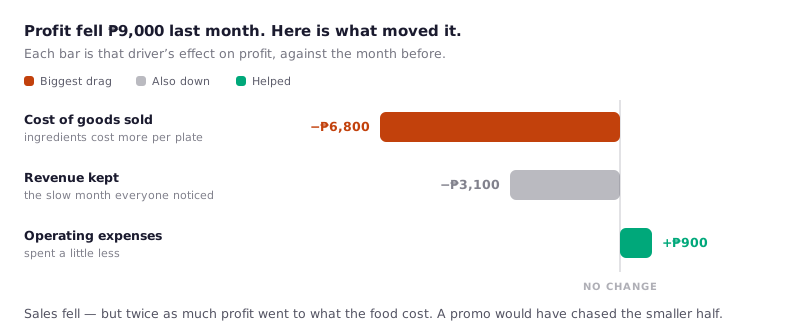
Read that carefully, because it is the most common shape of a slow month in a small kitchen. Sales did fall. But more than twice as much profit disappeared into what the food cost, and no promotion on earth fixes that. A shop reading only the sales line would have spent the month discounting — working harder, for less, at the smaller half of the problem.
This is the whole argument for planning from the breakdown rather than from the feeling. The feeling knows the shop was quiet. The breakdown knows where the money went.
A strategy is three sentences
Once you know the driver, write the plan down. Three lines is enough, and all three have to be there:
The lever. The one thing I am changing. The number. Which figure should move, from what to what. The deadline. The date I will look, and decide.
Worked examples, in the form they should take:
- Re-do the portion yields on the three chicken dishes. Cost of goods ratio from 38% to 34%. Check on the 30th.
- Drop the 7am opening to 8am on Tuesdays and Wednesdays. Same daily sales, one fewer staff hour per day. Check in two weeks.
- Offer the upsize out loud on every order. Average order from ₱185 to ₱200. Check on the 15th.
Two rules about the number. It has to be one figure, not a mood — "busier" is not checkable, "customers per day from 70 to 85" is. And it has to be a figure you already see without extra work, in your reports or on the Analytics page. A number that takes an evening of arithmetic to produce is a number you will not check, and an unchecked plan is just a hope with a date on it.
Four levers, and the number that points at each
Most slow-month plans end up in one of four places. Each has a reading that tells you whether it is your problem, and a figure that should move if you pull it.
Buying and waste. When the cost of goods is the biggest drag, the plan is here. Check your recipe yields against what the kitchen actually serves, and look at wastage for the slow weeks — it spikes quietly, because you ordered for a normal one. Watch: cost of goods ratio, wastage cost.
Price and mix. If the basket shrank rather than the queue, the plan is in what people order and what each item earns you. Your product-level report ranks items by revenue and by profit, and those two lists are rarely the same. Price Lab will test a price change against your real sales history before you commit to it. Watch: average order value, gross margin.
Hours and staffing. The peak-hours breakdown shows when money actually arrives. Shops routinely staff a dead hour and close before the last wave. This is the fastest lever to pull and the one with the most certain payoff, because you are removing a known cost rather than betting on new demand. Watch: sales per staff hour, and whether daily sales hold.
Demand. Bringing more people in — posts, regulars, an online store link, KAISHA's action plan built from your own numbers. Worth doing, but be honest that it is the slowest of the four to move and the least certain. It should rarely be your only bet in a month you need to fix now. Watch: customers per day, returning customers.
Give it a fixed window and change one thing
Two weeks is the minimum useful window, and a full pay cycle is better. Below that, the ordinary noise of a small shop — a wet Tuesday, a fiesta, the stretch before the 15th — is larger than any effect you just created. You will read the weather and call it a result.
Change one thing per window. Five simultaneous changes teach you nothing, because when the month improves you will not know which one to keep, and when it does not you will not know which one to stop. This is the single most expensive habit in small-shop management: a year of activity, and nothing learned that can be used again.
If a second idea is burning a hole in your pocket, write it down and run it next window. It will still be there.
Read the result against profit, not revenue
Revenue on your Analytics page is gross — the total on the receipts, tax included, with none of your costs taken out. It is the right number for "how busy were we" and the wrong number for "did that work". A discount-led plan reliably lifts revenue and lowers what you keep, which is exactly how a failed plan gets mistaken for a successful one.
Judge against the Profit Trend and against the specific figure you named in your three sentences. Nothing else counts as the answer.
One trap worth naming: the month you are standing in is only as long as the days that have happened so far. Ten days in, it sits about a third of the way up a normal month, which looks like a collapse and is not one. Analytics draws it faded and keeps it out of the forecast for that reason — but a mid-month glance at the bare number will still scare you. Compare finished periods with finished periods.
Keep, kill, or scale
At the deadline there are only three honest answers.
- It moved the number. Keep it, and make it the way the shop runs — a written portion, a changed opening time, a line in the shift briefing. A change that lives only in your memory is gone in a month.
- It did nothing. Kill it. This is a result, not a failure: it cost you one window and bought you a fact about your business, which is more than the average promo delivers. Write down that you tried it, so you do not spend next quarter rediscovering it.
- It moved the number more than you expected. Scale it, carefully, and check the constraint you are about to hit — stock, kitchen capacity, one person doing everything at 6pm.
Then pick the next lever. A shop that runs one honest two-week experiment a month knows twelve real things about itself by the end of the year. That is what a strategy actually is at this size.
What your numbers will not tell you
Worth being straight about the limits, because a plan built on a misread number is worse than no plan.
The forecast needs history. It will not project at all until you have six completed months, and between six and nine it marks itself indicative. The band around it is a flat ±15% that does not widen the further out it looks — real uncertainty does. It is a planning aid for stock and staffing, not a number to sign a lease against.
Analytics knows what happened, not why. It cannot see the road works outside, the competitor who opened in August, or the fiesta that moved. Write the context beside the number at the time — a one-line note on the month — or next year you will be looking at a dip with no idea what caused it.
A month is a small sample. In a shop doing a hundred orders a day, a single large catering order or one closed Monday moves a monthly figure noticeably. Before you act on a difference, ask whether one unusual day made it.
What this looks like in practice
The shop in the chart above: profit down ₱9,000, sales down, and the owner's first instinct is a weekend promo.
The breakdown says otherwise. Cost of goods took ₱6,800 of that profit against ₱3,100 from the slower month. So the lever moves to the kitchen: a check of the chicken yields finds portions have drifted upward since the last time anyone weighed one, and wastage in the two quiet weeks is nearly double the usual, because the standing order never changed.
The plan, in three sentences: re-weigh and re-record the yields on the three chicken dishes, and cut the standing chicken order by 15% for two weeks. Cost of goods ratio from 38% to 34%, wastage cost under ₱1,500. Check on the 30th.
That is a plan you can check, that costs nothing to run, and that keeps working after the slow month ends — which the promo would not have.
The short version
A slow month rewards a plan and punishes activity. Diagnose first, then let the month-over-month breakdown name the driver rather than choosing the lever by which problem is loudest. Write it as one lever, one number, one deadline. Give it two weeks and change nothing else. Judge it against profit, not revenue. Then keep, kill, or scale it, and pick the next one.
Kasenso keeps the breakdown, the profit trend, the product ranking and the cost figures in one place, so the lever is something you can read instead of something you have to guess at — on the free plan, permanently.